LYFT- Rate your ride
Client: Class Assignment
Project Timeline: 3 Weeks (September 2017)
Advisor: Dr.Paul Parsons
Team Members: Yexin Yang, Michael Sanz
Design Keywords: System Design, User Experience, User interface design
Role:
Secondary and Primary Research | Conceptualization | Problem Scoping | Decision making and structuring | Presentation and Documentation | Stakeholder Mapping
Design Brief
Lyft is one of the fastest growing companies in the new “sharing economy.” Consider that one of the world’s largest transportation companies owns no fleet of vehicles, and employs only 1600 people, despite the fact they facilitate over one million rides per day in up to 300 US cities. One of the most important mechanisms that enables the sharing economy is qualified and accurate ratings from users, which allow operators to divert resources appropriately and reward contractors that provide high levels of customer service. The current rating system tacitly encourages users to rank their driver using only very good or very bad rankings, due to the known limitations of a five-star scale.
As given in design situation, our goal is to create a replacement for the current five-star rating system that Lyft uses to track and reward drivers in their system. We considered the ways various rating systems constrained the input of users, the ease of use (e.g., speed of input in a busy urban environment), and the ways in which this information could be used maliciously against drivers.
Design Process

Secondary Research

about lyft
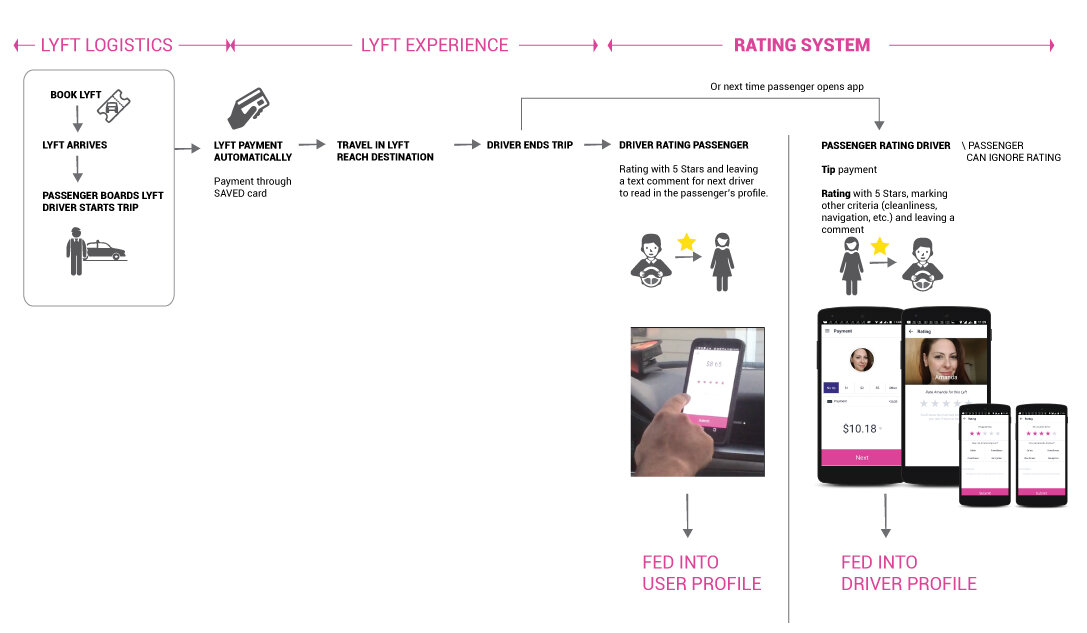
Lyft use two-way rating system with the goal to ensure the safety and comfort of their service. By two way, they mean that both drivers and passengers will rate each other. When one side rate less than 3 stars, they won’t pair again. The score of drivers are the average of their last 100 ratings or how many they have been received so far. 4.8 is the boundary for good score. Drivers with scores lower than 4.8 should pay attention to the problem they have. Constant low scores will cause deactivation.
Except stars, there are also four flags for users to give feedbacks, which are navigation, safety, cleanliness, and friendliness. A complete journey map of using Lyft is presented below.
DIFFERENT RATING SYSTEMs
There are many kinds of rating system: Thumbs up and down, Likes, Emoji rating, Metacritic: scores 0 - 100, Yelp: stars + comments, Slider, Goodfil.ms: especially for movie; separated aspects.
current user journey
Stakeholder mapping
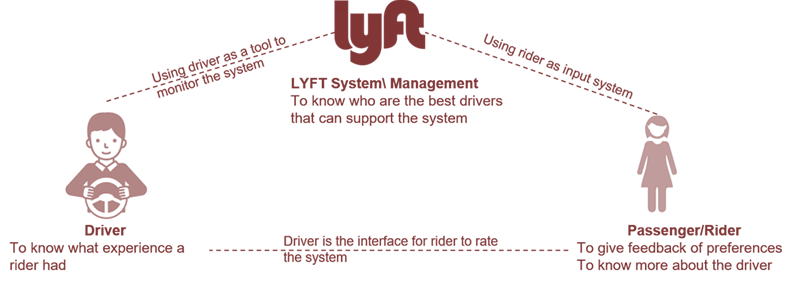
Stakeholder map of the system
Another important aspect to understand to go forward with the design process was the stakeholder analysis to map out How rating system affects each stakeholder ? The stakeholders include driver, LYFT management and rider. This map was formulated to understand how every stakeholder is connected and uses one and another as a tool to get data points and experiences. As it explains, the role of each stakeholder is mentioned and the connections are mentioned on the arrows. This map is used again while the solution is mentioned to highlight how the solution fits and impacts everyone in this stakeholder map.
primary research- interviews
We had 5 interviewees, which included one driver and four passengers. Our interview was semi-structured, and the interview questions were carefully selected to understand how people rate, what affects their ratings, and their specific opinions about Lyft’s rating system.
Key questions to riders: How often do you use Lyft? Can you narrate your whole journey of using Lyft, What are your best and worst experience with Lyft? How did you rate them? Will you check the profile of a driver before you take the ride? What do you care most when you take a ride? What aspects will you consider when you rate a driver? How do you think the 5-star rating system? How do you interpret different stars?
Key questions to the driver: What are your best and worst experience with Lyft? How did you rate them?
Data Collection: Videos and audios were recorded and transcribed.
design ideation
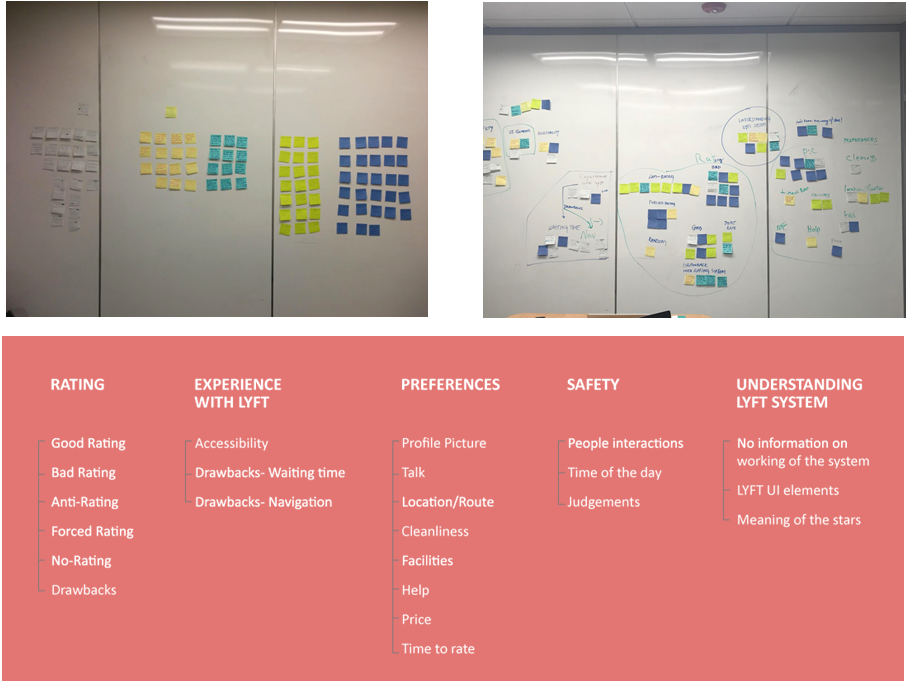
affinity diagramming
The user quotes from the interview transcripts were written on different post-it notes as shown in the image. Trying to find patterns in the data collected, an affinity map is created with five main themes: rating, experience with Lyft, preferences, safety and understanding Lyft system (right, below).
With this exercise of affinity mapping, we could formulate the following:
· Problem statement (in reference with secondary research)
· User behaviors of rating
· Preferences of users in a car ride
primary and secondary personas

Design Ideation
IDEA GENERATION & SKETCHES
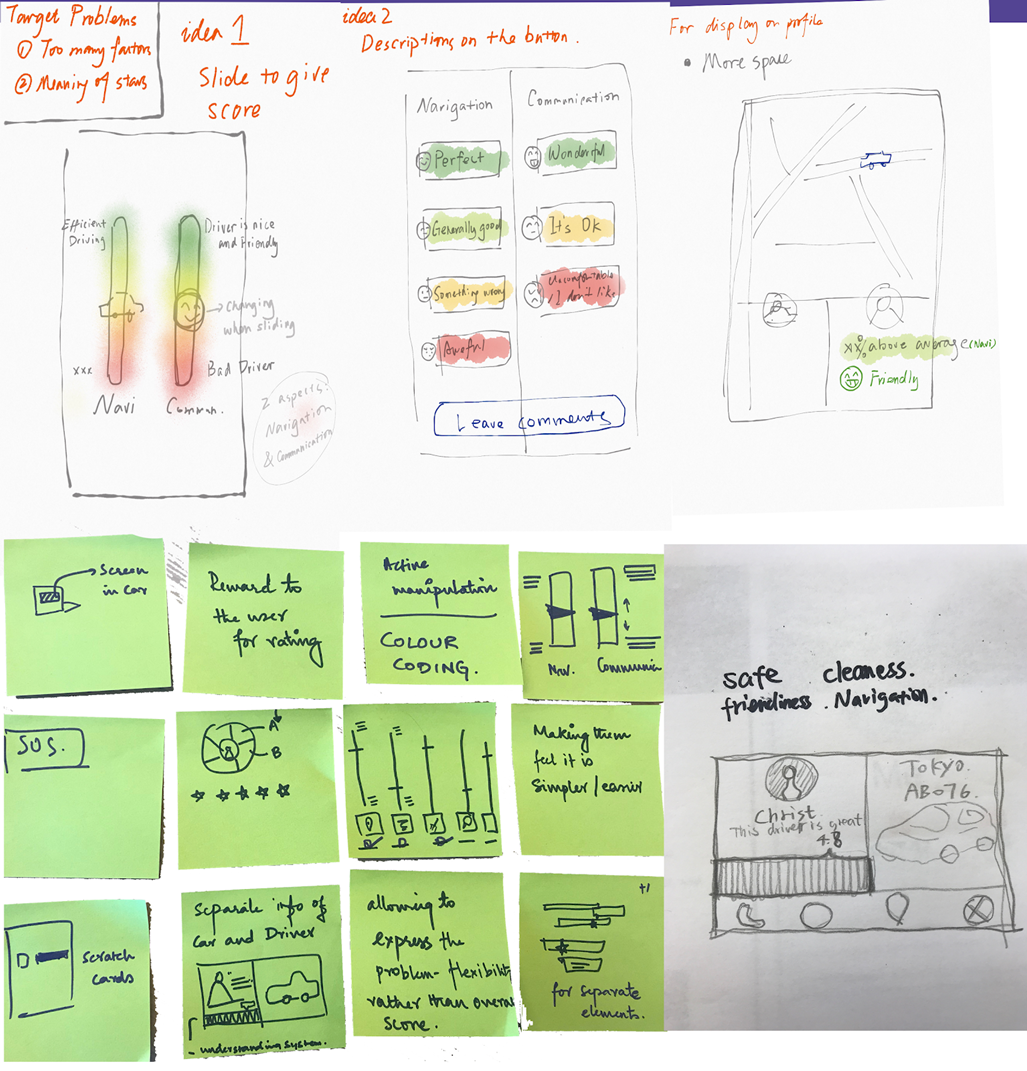
From all the understanding we had through our research and to solve the problem statement, we started to sketch different ways we can improve the rating experience. We had initial ideas in the categories:
· Using emojis to personify the rating · Implementing Slide Bars for different aspects of the ride experience to rate specifically · Color coding for different levels of rating to different between least to highest · Thinking beyond the mobile device experience like installing tablets in Car System itself for the riders to easily rate the driver
· Trying to implement Intelligent services (voice based rating, semantic analysis) · “Safety and Emergency of the driver and rider” based system
final ideas
Slider rating system with default set and emotional variance for the rider to express easily

Tip system with comments used as a rating system, driving both driver and rider on monetary reviews

Physical tablets to rate the driver in the car without extra effort of rating on the phone after the ride